
How to sketch direction fields
What is a direction field?
A direction field is a graph made up of lots of tiny little lines, each of which approximates the slope of the function in that area. You can create a direction field for any differential equation in the form
where is the derivative of the function , and and are numerical coefficients of and .

Hi! I'm krista.
I create online courses to help you rock your math class. Read more.
How to create a direction field for the differential equation
What you want to do is create a field of equally spaced coordinate points, and then evaluate the derivative at each of those coordinate points. Since the derivative is the same thing as the slope of the tangent line, finding the derivative at a particular point is like finding the slope of the tangent line there, which of course is an approximation of the slope of the actual function.
Once you find the value of the derivative at each coordinate point, you sketch a tiny line segment at the coordinate point, whose slope is the same as the value of the derivative.
Repeating this process across many coordinate points will create the direction field. From there, you can use the direction field to sketch solution curves through specific points in the field.
This is a step-by-step video walkthrough of how to sketch a direction field for a differential equation


Take the course
Want to learn more about Differential Equations? I have a step-by-step course for that. :)
An example of how to sketch the direction field
Example
Sketch a direction field for the equation and then sketch a solution curve that passes through .
For a differential equation in this form, we’ll sketch the direction field by using a set of coordinate pairs to find corresponding values for . For example, if we take the coordinate pair , we can plug it into the differential equation and get
Since is the derivative (which is also the slope of the tangent line), we can say that the slope of the tangent line at is . To sketch this information into the direction field, we’d draw a very small horizontal line (because horizontal lines have a slope of ), at the point .
The trick with these kinds of problems is keeping all this information organized. We’ll start by picking values for , like . Then we’ll choose the same values for , and we’ll pair each of them with each of the values we chose for . Since we have five values for , , and the same five values for , , we’ll get coordinate points. We’ll plug each of these points into the differential equation to find an associated value for .
For ,

For ,

For ,

For ,

For ,


A direction field is a graph made up of lots of tiny little lines, each of which approximates the slope of the function in that area.
To sketch this information into the direction field, we navigate to the coordinate point , and then sketch a tiny line that has slope equal to the corresponding value . Remember, if , the small line will be horizontal. If is positive, the line will be tilting to the right, and if is negative, the line will be tilting to the left. The larger the value of , either positive or negative, the steeper the line will be.
This is a good start, but we should really calculate more values in order to get a clearer picture of the direction field. If we take values for and that are halfway between those we’ve already evaluated, and we plot the associated values of , and we starting plotting as much as we can, we get a direction field that looks like this:

To address the second part of the question, we’ll sketch the solution curve that passes through .
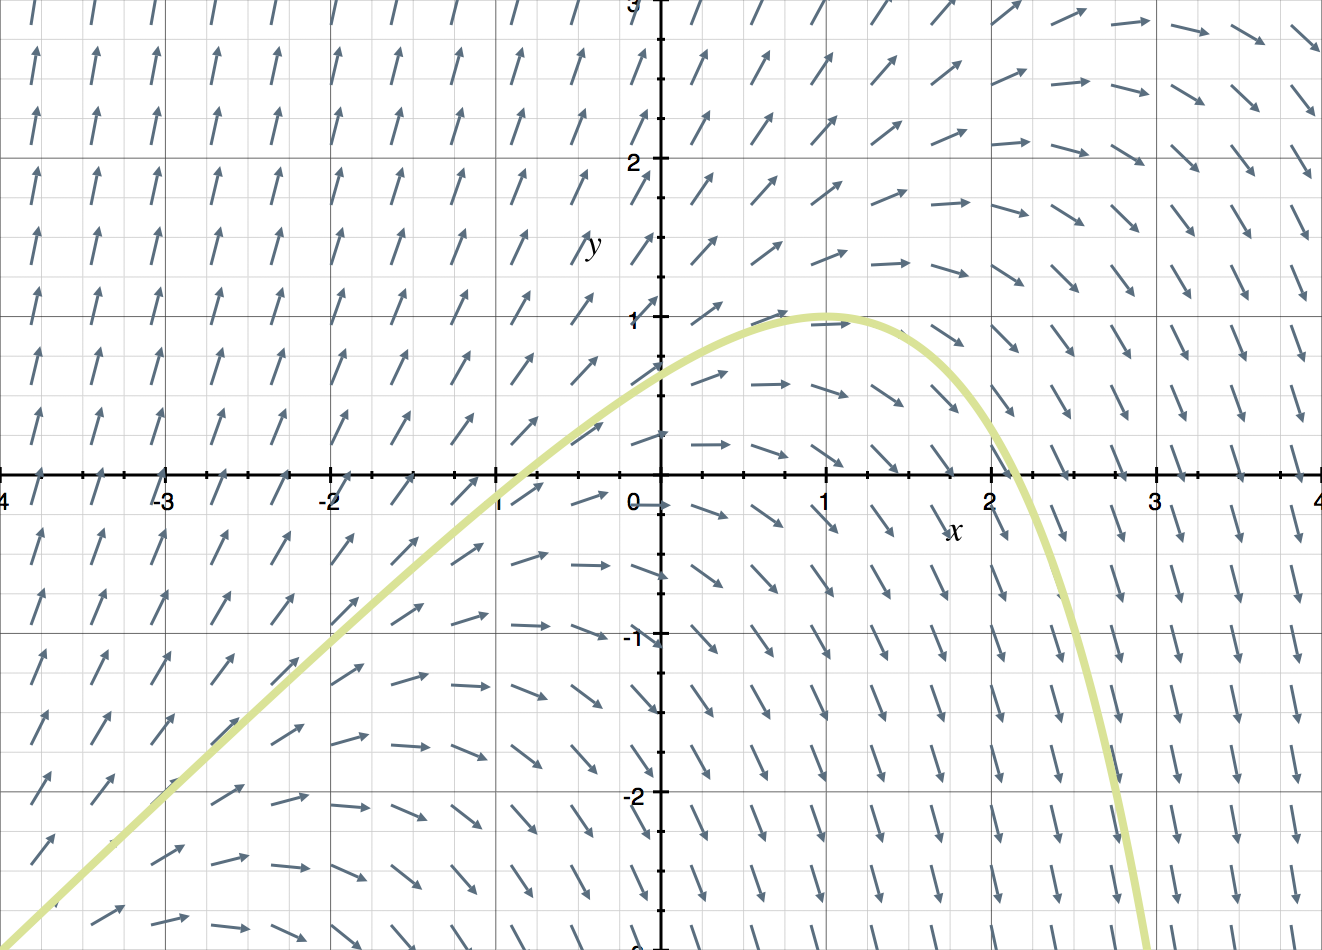
The solution curve is never exact. Instead, it’s an approximation we create as we follow the small lines in our direction field that indicate the slope of the curve near each line.
