
The p-value and rejecting the null (for one- and two-tail tests)
What is the p-value?
The ???p???-value (or the observed level of significance) is the smallest level of significance at which you can reject the null hypothesis, assuming the null hypothesis is true.
You can also think about the ???p???-value as the total area of the region of rejection. Remember that in a one-tailed test, the region of rejection is consolidated into one tail, whereas in a two-tailed test, the rejection region is split between two tails.

Hi! I'm krista.
I create online courses to help you rock your math class. Read more.
So, as you might expect, calculating the ???p???-value as the area of the rejection region will be slightly different depending on whether we’re using a two-tailed test or a one-tailed test, and whether the one-tailed test is an upper-tail test or lower-tail test.
Calculating the ???p???-value
For a one-tailed, lower-tail test
For a one-tailed test, first calculate your ???z???-test statistic. For a lower-tail test, ???z??? will be negative. Look up the ???z???-value in a ???z???-table, and the value you find in the body of the table represents the area under the probability distribution curve to the left of your negative ???z???-value.
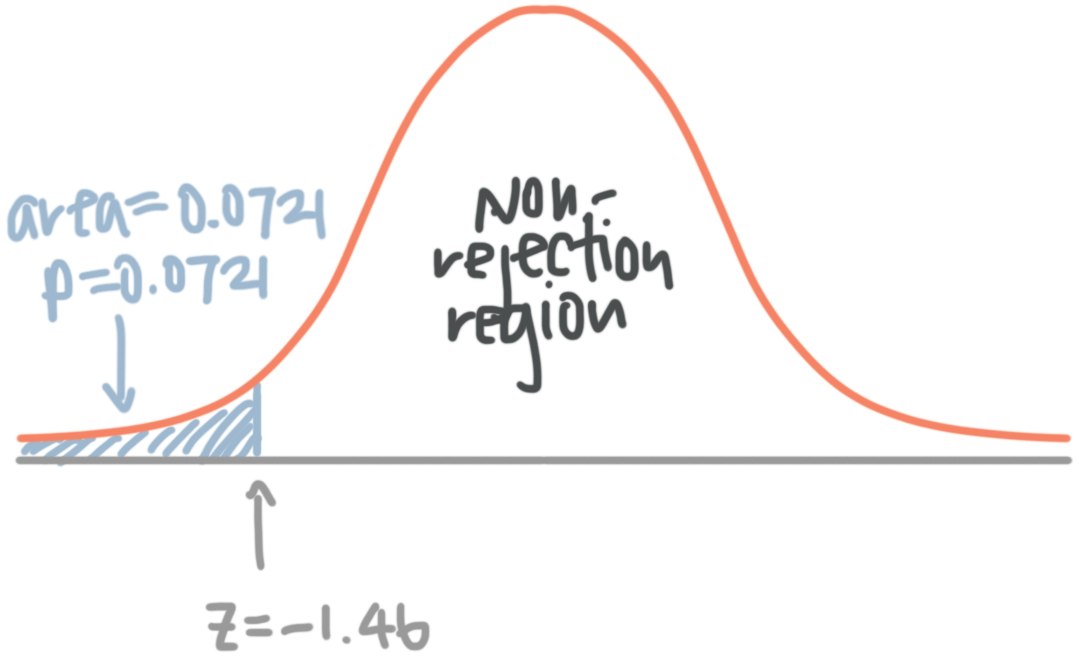
For instance, assume you found ???z=-1.46???. In a ???z???-table, you find
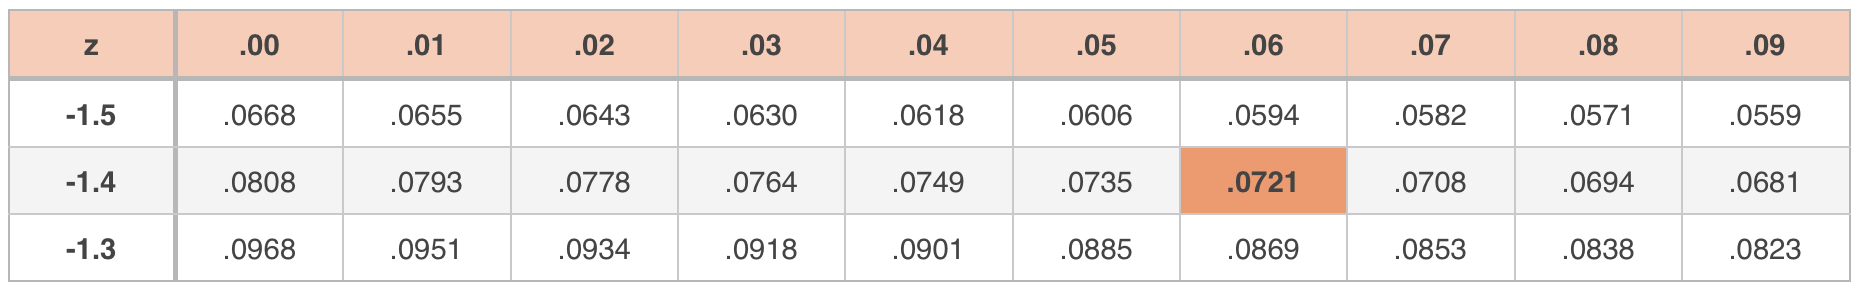
So ???0.0721??? is the area under the curve to the left of ???z=-1.46???, and this is the ???p???-value also. So ???p=0.0721???.
For a one-tailed, upper-tail test
For a one-tailed test, first calculate your ???z???-test statistic. For an upper-tail test, ???z??? will be positive. Look up the ???z???-value in a ???z???-table, and the value you find in the body of the table represents the area under the probability distribution curve to the left of your positive ???z???-value.
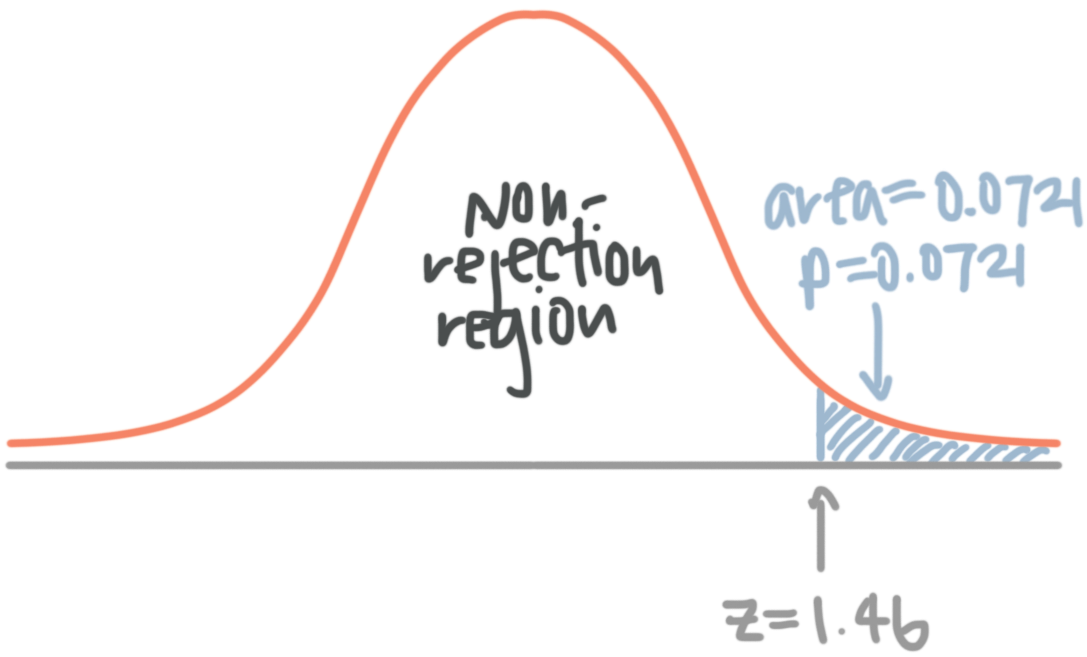
For instance, assume you found ???z=1.46???. In a ???z???-table, you find
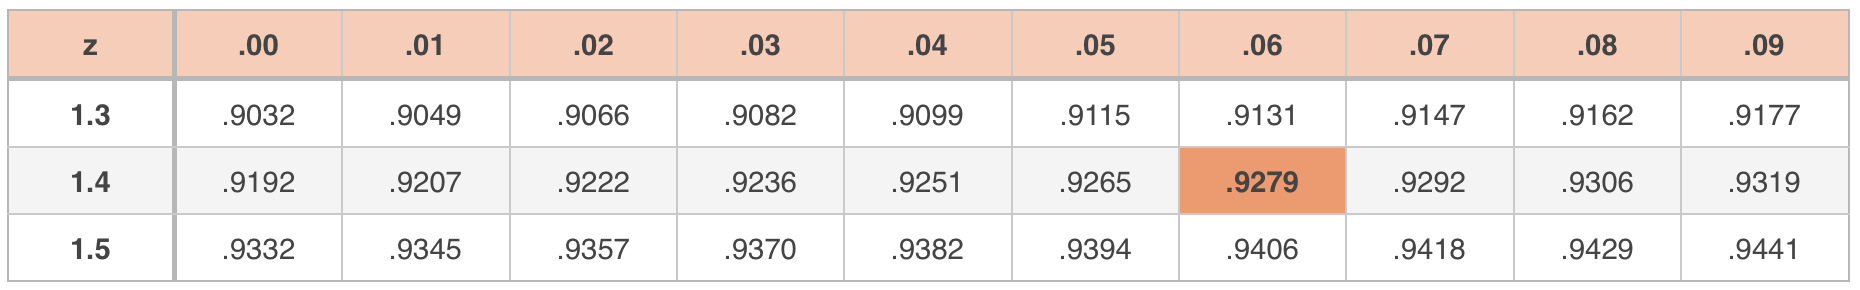
But in an upper-tail test, you’re interested in the area to the right of the ???z???-value, not the area to the left. To find the area to the right, you need to subtract the value in the ???z???-table from ???1???.
???1-0.9279=0.0721???
So ???0.0721??? is the area under the curve to the right of ???z=1.46???, and this is the ???p???-value also. So ???p=0.0721???.
For a two-tailed test
For a two-tailed test, first calculate your ???z???-test statistic. For an two-tail test, ???z??? could be either positive or negative. Look up the ???z???-value in a -table, and the value you find in the body of the table represents the area under the probability distribution curve to the left of your ???z???-value.
For instance, assume you found ???z=1.23???. In a ???z???-table, you find
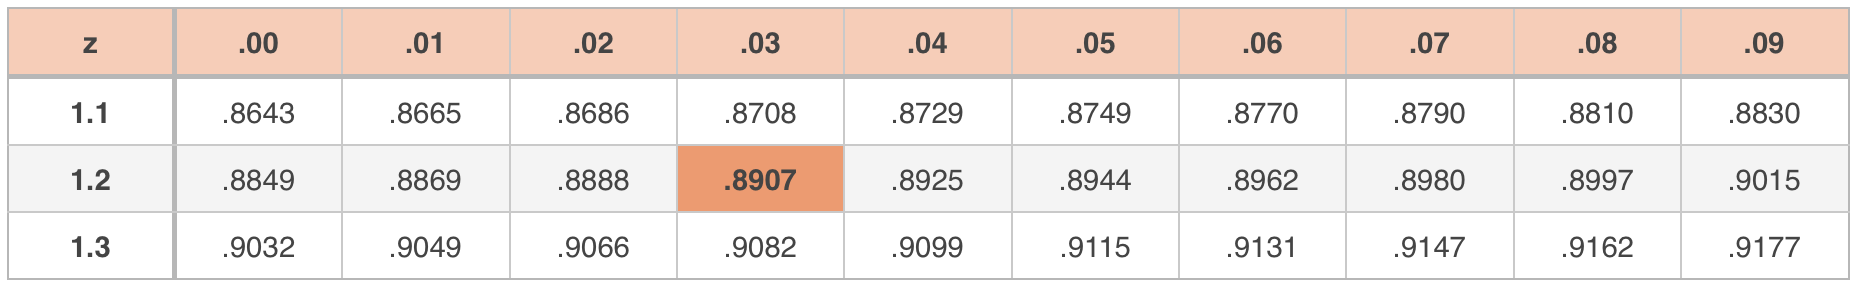
But for a positive ???z???-value, you’re interested in the area to the right of the ???z???-value, not the area to the left. To find the area to the right, you need to subtract the value in the ???z???-table from ???1???.
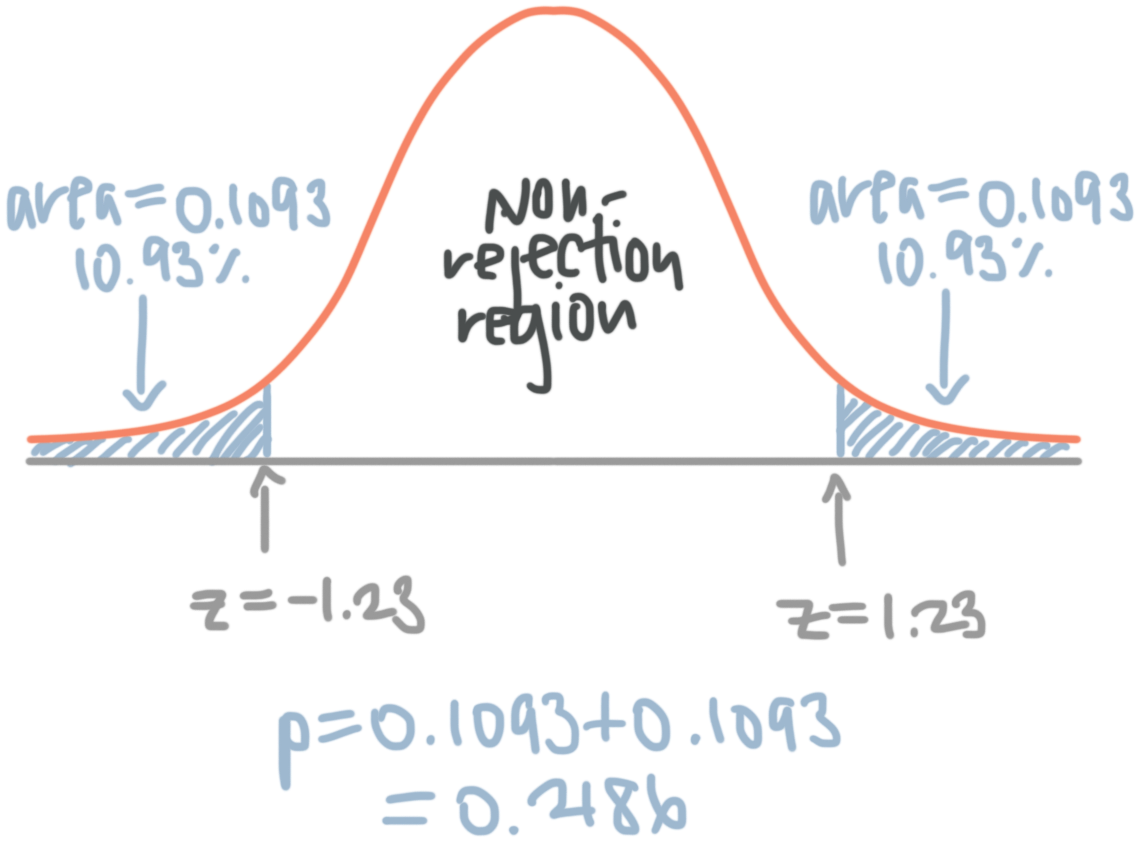
???1-0.8907=0.1093???
So ???0.1093??? is the area under the curve to the right of ???z=1.23???. Because this is a two-tail test, the region of rejection is not only the ???10.93\%??? of area under the upper tail, but also the symmetrical ???10.93\%??? of area under the lower tail. So we’ll double ???0.1093??? to get ???2(0.1093)=0.2186???, and this is the ???p???-value also. So ???p=0.2186???.
How to reject the null hypothesis
The reason we’ve gone through all this work to understand the ???p???-value is because using a ???p???-value is a really quick way to decide whether or not to reject the null hypothesis.
Whether or not you should reject ???H_0??? can be determined by the relationship between the ???\alpha??? level and the ???p???-value.
If ???p\leq \alpha???, reject the null hypothesis
If ???p>\alpha???, do not reject the null hypothesis
In our earlier examples, we found
???p=0.0721??? for the lower-tail one-tailed test
???p=0.0721??? for the upper-tail one-tailed test
???p=0.2186??? for the two-tailed test
With these in mind, let’s say for instance you set the confidence level of your hypothesis test at ???90\%???, which is the same as setting the ???\alpha??? level at ???\alpha=0.10???. In that case,
???p=0.0721\leq\alpha=0.10???
???p=0.2186>\alpha=0.10???
So we would have rejected the null hypothesis for both one-tailed tests, but we would have failed to reject the null in the two-tailed test. If, however, we’d picked a more rigorous ???\alpha=0.05??? or ???\alpha=0.01???, we would have failed to reject the null hypothesis every time.
Significance
The significance (or statistical significance) of a test is the probability of obtaining your result by chance. The less likely it is that we obtained a result by chance, the more significant our results.
Hopefully by now it’s not too surprising by now that all of these are equivalent statements:
The finding is significant at the ???0.01??? level
The confidence level is ???99\%???
The Type I error rate is ???0.01???
The alpha level is ???0.01???, ???\alpha=0.01???
The area of the rejection region is ???0.01???
The ???p???-value is ???0.01???, ???p=0.01???
There’s a ???1??? in ???100??? chance of getting a result as, or more, extreme as this one
The smaller the ???p???-value, or the smaller the alpha value, or the lower the Type I error rate, and the smaller the region of rejection, the higher the confidence level, and the less likely it is that you got your result by chance.
In other words, an alpha level of ???0.10??? (or a ???p???-value of ???0.10???, or a confidence level of ???90\%???) is a lower bar to clear. At that significance level, there’s a ???1??? in ???10??? chance that the result we got was just by chance. And therefore there’s a ???1??? in ???10??? chance that we’ll reject the null hypothesis when we really shouldn’t have, thinking that we provided support for the alternative hypothesis when we shouldn’t have.
But a stricter alpha level of ???0.01??? (or a ???p???-value of ???0.01???, or a confidence level of ???99\%???) is a higher bar to clear. At that significance level, there’s only a ???1??? in ???100??? chance that the result we got was just by chance. And therefore there’s only a ???1??? in ???100??? chance that we’ll reject the null hypothesis when we really shouldn’t have, thinking that we provided support for the alternative hypothesis when we shouldn’t have.
If we find a result that clears the bar we’ve set for ourselves, then we reject the null hypothesis and we say that the finding is significant at the ???p???-value that we find. Otherwise, we fail to reject the null.

